Your
private
investment
and
dividend
tracker.
Take control of your financial future with absolute clarity. A beautifully simple, private space to watch your stocks, ETFs, crypto and dividend income grow, without hidden fees, noisy alerts, or anyone selling your data. See your true performance in every currency, forecast your passive income month by month, and keep your financial life entirely your own. No brokerage login required, ever.
Markets you actually want, in one place
Live prices via Yahoo Finance, refreshed periodically and may be delayed.
Built for investors who want clarity, not clutter
Whether you're starting with your first ETF or managing dozens of positions across several currencies, Portfolio Analytics fits in.
Dividend income investors
Your dividends are the foundation of the life you are designing. Map the reliable, predictable income coming in month by month, track yield on cost, and watch your year-over-year growth compound.
See each holding's contribution to your annual income, follow its payout history and dividend growth rate, and project the next twelve months with confidence. Closed positions are filtered out automatically, so your forward forecast stays honest enough to plan a lifestyle around, whether you reinvest to compound faster or draw the income to live on.
Long-term buy & hold
Patient investing deserves honest math, not daily anxiety. See your genuine annualized return with Newton-Raphson XIRR across years of buys, sells and reinvestments, and benchmark against the NASDAQ 100, S&P 500, Dow Jones, gold or bonds, without flinching at every market swing.
Multi-currency investors
Holding assets in USD, EUR, GBP, CHF, JPY, CAD, AUD, RON or ILS should not mean juggling exchange rates in your head. Every position converts into one reporting currency automatically, with per-currency chips on every stat card, so your global portfolio finally reads as a single, coherent story.
ETF & index investors
Every European ETF (.DE, .PA, .L, .AS) is fully supported, with automatic sector and country breakdown. Look through your funds to the real underlying allocation, and benchmark each one against the NASDAQ 100, S&P 500 or any major index.
Active traders
Daily change per holding, top gainers and losers for any period, and a heatmap of today's moves sized by position. Switch from 1D to 5Y without a reload and read your portfolio's momentum at a glance.
Privacy-conscious
Your financial life belongs to you and your family alone. Your holdings are never sold, never shared, and never exposed through a brokerage connection, because you choose what to add. Protected by TOTP two-factor authentication and a full audit log, with one-click deletion whenever you want out.
Three steps from empty dashboard to full insight
No complicated setup, no broker integrations to configure. Just log your trades and Portfolio Analytics does the rest.
Create your account
Sign up with email or Google in under 30 seconds. Verify your inbox, enable 2FA if you want, and you're in. First user becomes Super Admin, ideal for families or small teams.
Add portfolios & transactions
Create one or many portfolios (e.g. "Retirement", "Dividend", "Growth"). Enter buys, sells and dividends manually, or bulk-import a CSV from your broker.
Analyse & optimise
Prices refresh automatically from Yahoo Finance, so the moment your trades are in you see live market value, daily change and unrealized gain. Switch between Chart, Heatmap and Details views, spot top gainers and losers, project next year's dividend income and benchmark against the NASDAQ 100 or any major index.
Your portfolio at a glance
A clean, powerful dashboard that shows everything you need. No clutter, no noise.
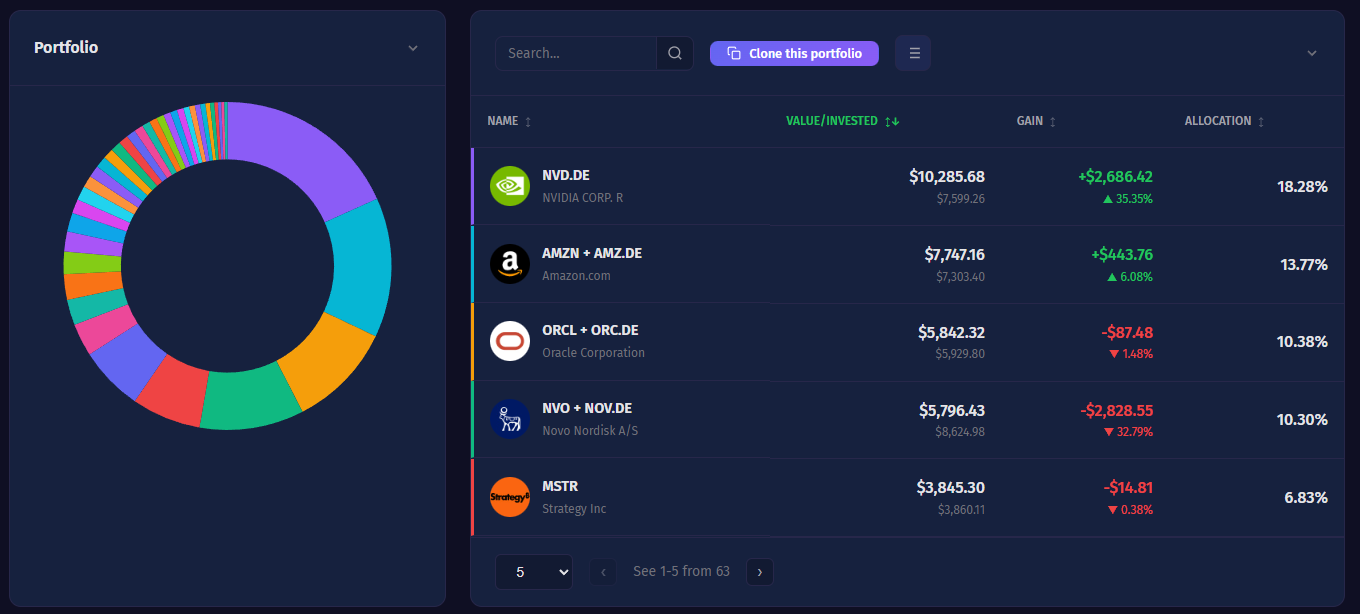
Seven live KPIs, in every currency, at a glance.
The moment you open your dashboard, the seven metrics that actually matter are already there: total value, total cost basis, unrealized gain, realized gain, dividend yield, annual income and daily change. Each one carries multi-currency conversion chips, so a portfolio spread across continents collapses into one clear, trustworthy number, refreshed every five minutes from the Yahoo Finance API.
- Allocation donut + sortable holdings table on the same screen.
- Click any symbol to jump straight to its candlestick chart.
- Switch reporting currency on the fly, totals re‑convert with live FX.
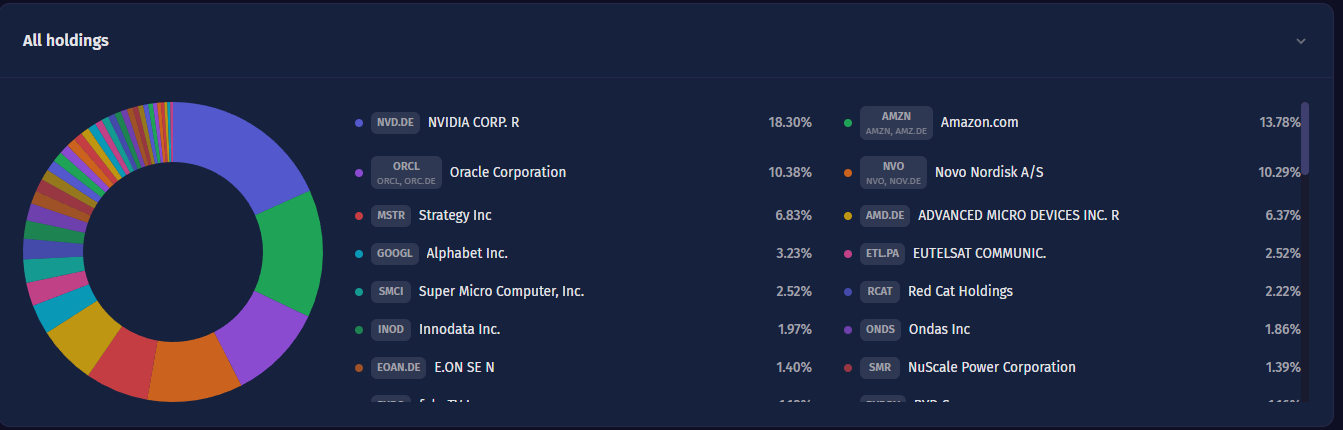
See exactly where your money truly lives.
Real diversification is not a pie chart, it is understanding the path your money takes. The Diversification X-Ray uses an interactive Sankey diagram to trace your holdings through sector and into country, and a Holdings Map treemap to size every position visually. In seconds you can spot a quiet over-concentration that a simple list would have hidden, and rebalance with confidence.
- Donut + bar combo so you read both share and absolute size.
- Sector / country / class views switch instantly, no reloads.
- Holdings Map treemap sizes positions by value, colours by today's move.
Everything you need to manage your portfolio
Powerful tools for serious investors. Track, analyse and optimise your investment strategy, all in one clean dashboard.
Real-time portfolio tracking
Live stock prices via Yahoo Finance with automatic 5-minute refresh. Track stocks, ETFs, crypto, mutual funds and international tickers across unlimited portfolios.
Dividend analytics
Track dividend income, yield, payout history and growth rates. Monthly and 12-month projections plus per-stock income breakdown. Closed positions are automatically excluded.
Performance metrics
IRR (XIRR), total return, daily P&L, realized and unrealized gains, yield on cost and dividend yield. The KPIs serious investors actually use.
Multi-currency support
Track investments in USD, EUR, GBP, CHF, JPY, CAD, AUD, RON, ILS and more. Per-currency totals across every portfolio, with live FX conversion for reporting.
Diversification analysis
Visualise allocation by sector, country and asset class. Top-15 holdings breakdown with interactive donut charts and equal-weight rebalancing suggestions.
CSV import & export
Bulk import transactions from any broker's CSV export. Validate, map and import thousands of rows in seconds. Export your whole portfolio back out anytime.
Candlestick & line charts
Markets tab with Stock Detail: type any ticker and switch between candlestick and line. 1D intraday (5-minute bars), 1W (hourly), 5D, 1M, 3M, 6M, YTD, 1Y, 5Y, MAX or custom. Six index sparkline cards, click any to load it.
Stock Intersection X-Ray
Sankey diagram links portfolios to symbols, so you can spot overlap across multiple portfolios at a glance. Pair it with the Holdings Map treemap for an instant sense of position size.
Benchmark vs the market
Compare your real, money-weighted return against the NASDAQ 100, S&P 500, Dow Jones, gold or bonds over any period. See whether your strategy actually beats simply buying the index, in one honest chart.
Three ways to see your winners and losers
Same data, three views, switch instantly, no reload. Filter by 1d, 7d, 1m, 3m, 6m, YTD, 1y, 5y or all-time.
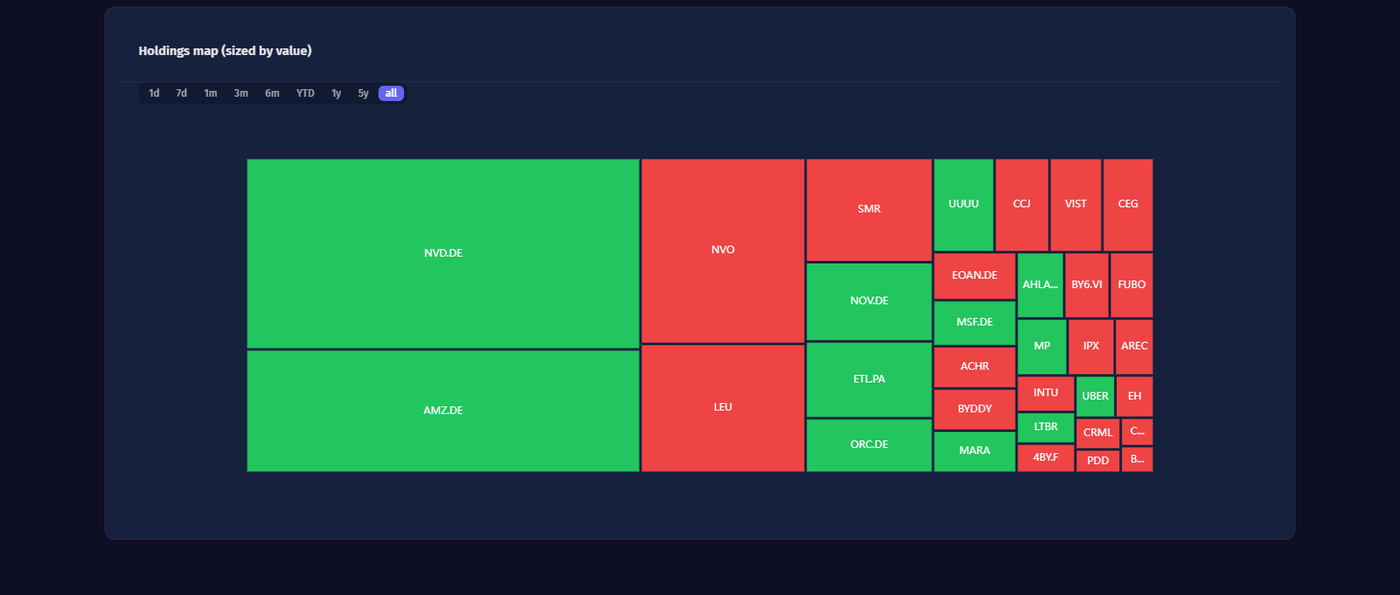
The whole portfolio in one glance.
Treemap tiles are sized by market value and coloured by % change, green for gainers, red for laggards. Period filters from 1‑day to all‑time. The fastest way to read your portfolio on a busy day.
- Chart view, horizontal % bars sorted by performance.
- Heatmap view, treemap sized by value, coloured by daily move.
- Details view, sortable table with Shares, Avg Cost, Price, Value, Gain $/%.
Candlestick charts for every ticker
Type any Yahoo-supported symbol, stock, ETF, crypto or index, and read it like a pro.
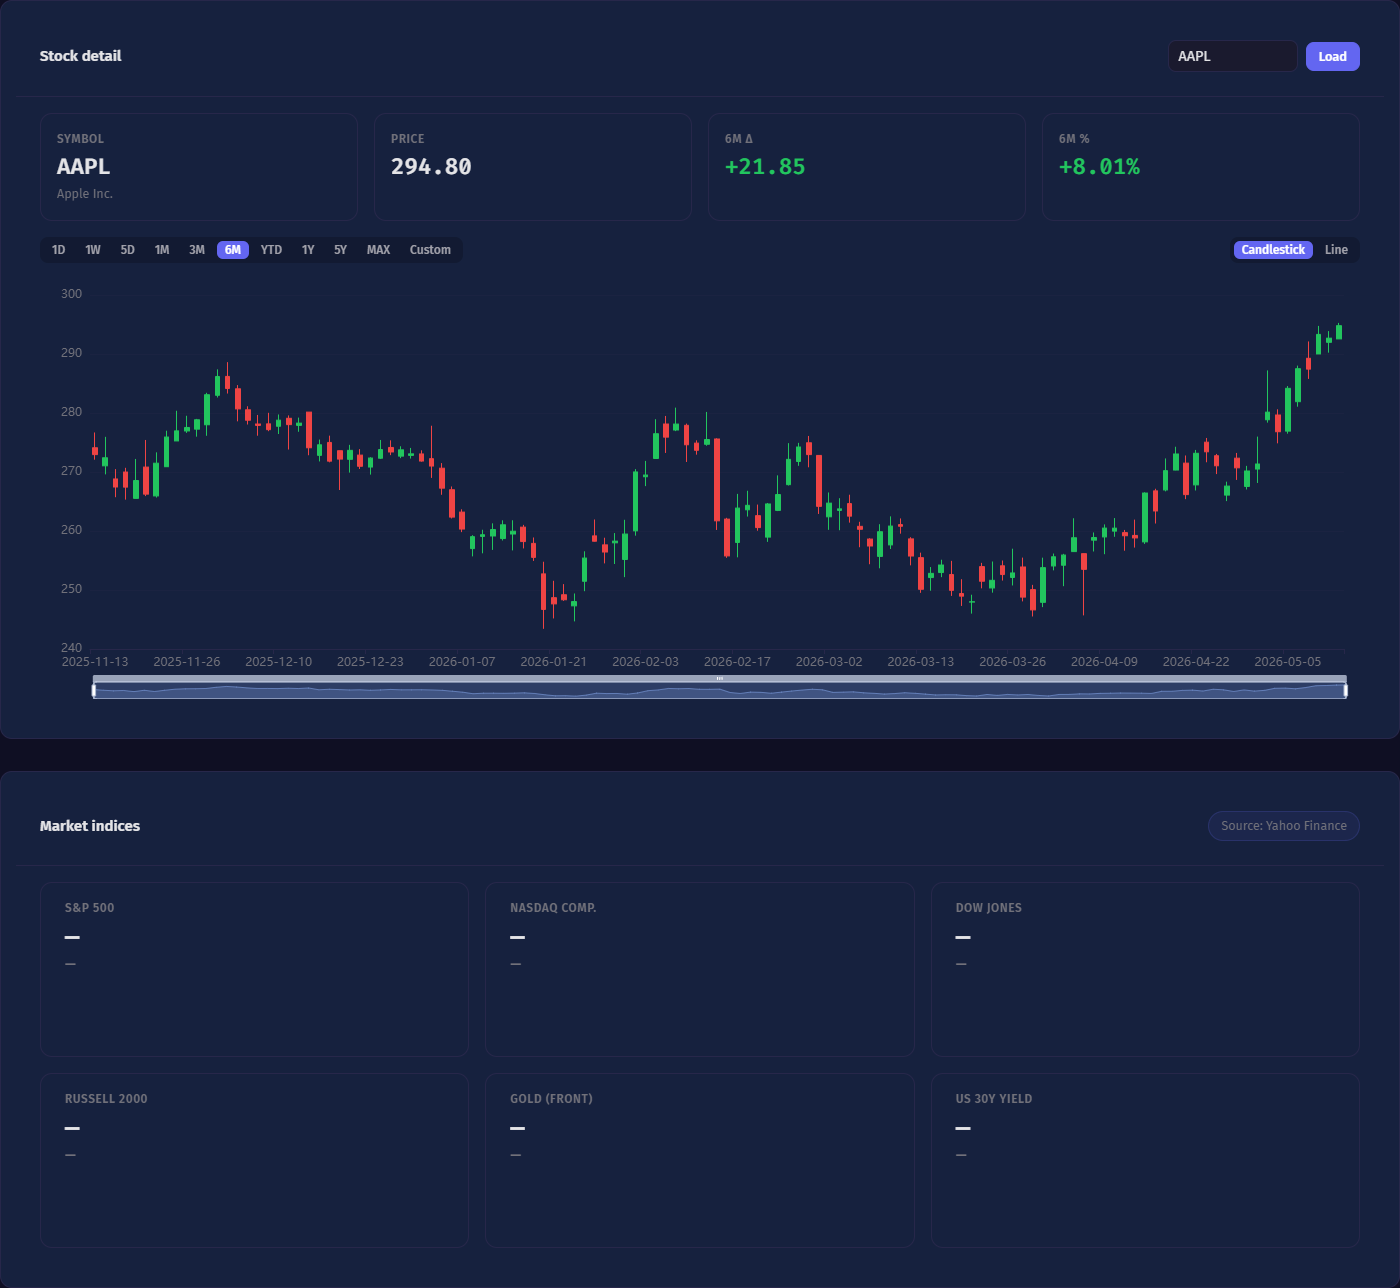
1D intraday to all‑time. Candlestick or line. Any ticker.
Periods cover 1D intraday (5‑minute bars), 1W (hourly), 5D, 1M, 3M, 6M, YTD, 1Y, 5Y, MAX and a custom date range that auto‑picks an appropriate interval. Six index cards, S&P 500, NASDAQ, Dow, Russell 2000, Gold, US 30Y Yield, with sparklines and one‑click load.
- Type a ticker (AAPL, VWCE.DE, BTC‑USD, EUNL.DE…) and hit Load.
- Click any index card or portfolio symbol to load it instantly.
- Custom range picker auto-selects the interval (daily / hourly / 5‑min).
Detailed dividend analytics
Everything passive income investors need to track, analyse and grow their dividend portfolio. Closed positions are automatically filtered out so your projections stay accurate.
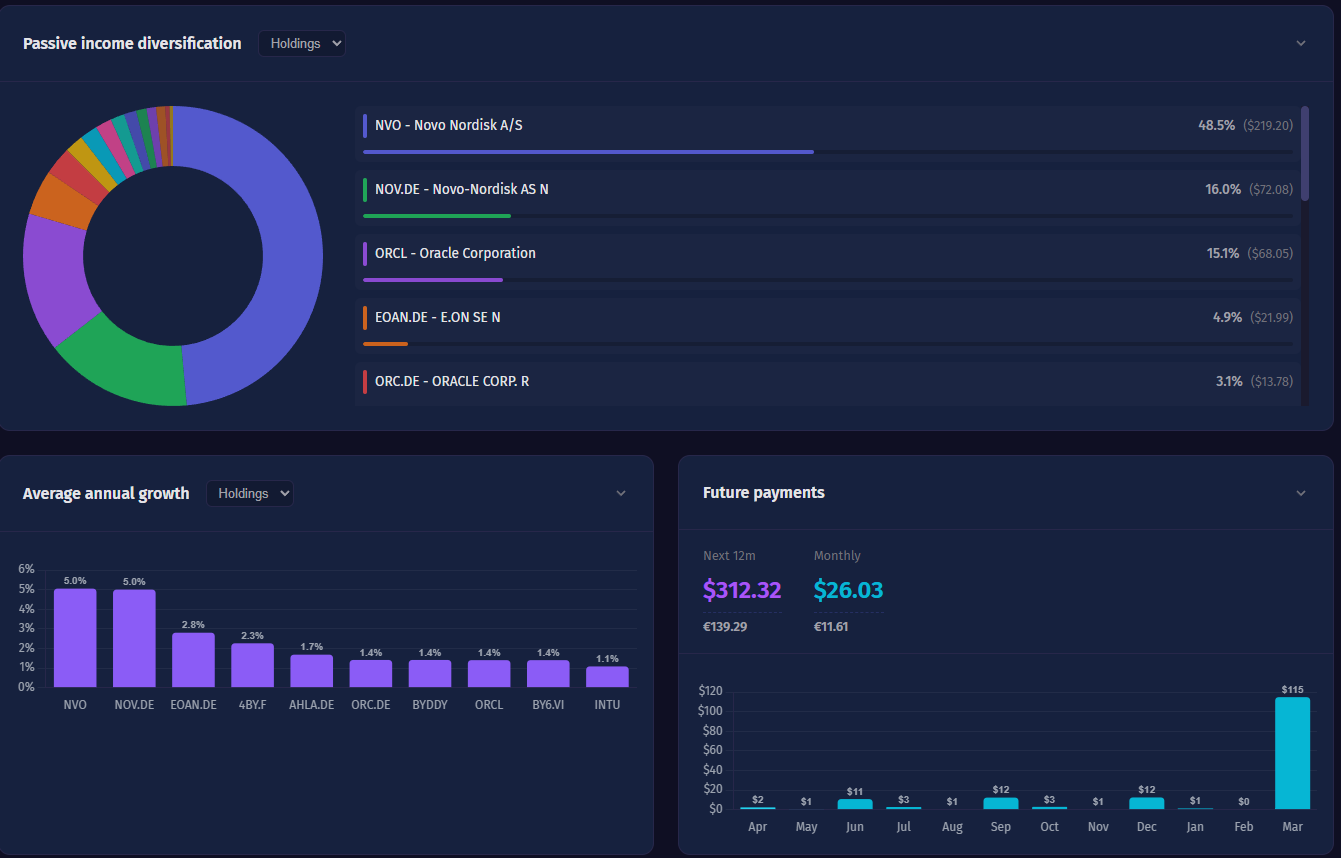
A forward 12-month forecast that only counts what you still own.
Your passive income deserves a forecast you can rely on, not an inflated guess. Portfolio Analytics projects the next twelve months of dividends from your live holdings and automatically filters out closed positions, so a stock you already sold never pads your numbers. Yield on cost sits beside current yield, and average annual growth shows where your income is compounding.
- Per-month and 12-month projections from actual payment history.
- Yield on cost vs current yield, side by side.
- Closed positions auto-excluded, forecasts stay honest.
Income tracking
Total dividends received by month, quarter and year. Per-stock breakdowns, historical payment counts, and forecasts for the next 12 months based on your actual payment history.
Yield analysis
Current yield and yield on cost side by side. Spot which positions pay the highest income relative to what you originally paid, not just to today's price.
Growth projections
Year-over-year dividend growth rates and 12-month payment forecasts. Interactive charts let you drill into any year, month or symbol.
Portfolio metrics, in plain English
Don't let finance jargon get in the way. Here's what each number on your dashboard actually means.
Total Value
The current market value of everything you hold, in your reporting currency. It updates every 5 minutes with live prices.
Total Gain
Unrealized gain (on positions you still hold) plus realized gain (on positions you've sold) plus dividends received. The all-in "how am I doing" number.
IRR (Internal Rate of Return)
The annualised return that accounts for when you added or removed money. Unlike a simple percentage, IRR stays honest across years of deposits, withdrawals and reinvestments.
Dividend Yield & Yield on Cost
Dividend yield = projected annual dividends ÷ current value. Yield on cost = projected dividends ÷ what you originally paid. Yield on cost is usually higher, and tells you how well your past buying decisions are paying off today.
Daily Change
How much your portfolio moved today, in both dollars and percent, broken down by currency. Hidden if the market is closed or if you only have non-trading assets.
Heatmap
A treemap-style grid where bigger positions get bigger tiles and the colour shows today's move. The fastest way to spot what's working and what's lagging.
Enterprise-grade security for personal finance
Your financial data is protected with multiple layers of security and strict per-user data isolation.
Two-factor authentication
TOTP-based 2FA works with Google Authenticator, Authy, 1Password or any authenticator app.
Google OAuth
Sign in securely with your Google account. No extra password to remember.
Trusted devices
Skip 2FA for 30 days on a browser you trust. Revoke at any time from your account settings.
Encrypted session cookies
Your login lives in an httpOnly cookie that JavaScript cannot read, with CSRF protection on every action, so your session cannot be lifted from the browser by a malicious script.
Full audit log
Every login, password change, transaction and admin action is logged with IP, device and outcome, you can review or export it any time.
Strict data isolation
Every API call is scoped to your user ID at the database query layer. No admin panel or analytics backdoor can ever see your portfolios.
Free. Forever. Really.
No hidden fees, no credit card required, no feature limits. Just sign up and start tracking.
- Unlimited portfolios and transactions
- Real-time stock, ETF and crypto prices
- Dividend analytics & 12-month projections
- Multi-currency support (9+ currencies)
- Holdings Performance, chart, heatmap, details
- Top gainers / losers with time-period filter
- Benchmark comparison vs. major indexes
- CSV import & export
- 2FA + Google OAuth + Trusted Devices
- Full audit log & account deletion
- No ads. No trackers. No data selling.
Frequently asked questions
Stocks, ETFs, mutual funds, cryptocurrencies, indices and international tickers (e.g. AAPL, VWCE.DE, NOVO-B.CO, BTC-USD). Prices come from Yahoo Finance with automatic 5-minute refresh.
Yes. Portfolios support USD, EUR, GBP, ILS, CHF, JPY, CAD, AUD, RON and more. Multi-currency totals are shown per currency and in your chosen reporting currency.
Your performance is calculated using the Newton-Raphson XIRR iteration method, a time-weighted internal rate of return that accounts for the exact date and size of every contribution and withdrawal. When a solution cannot converge, the engine falls back to a bisection method rather than reporting a misleading rate. Total return combines unrealized gain, realized gain and dividends received, and your cost basis resets correctly each time you fully close and reopen a position, so the numbers stay honest across years of investing.
Yes. Import a CSV from any broker; the importer validates every row and shows a clear preview before writing anything. You can export your data back out as CSV at any time.
Yes. The Markets tab has a Stock Detail panel: type any Yahoo-supported ticker, switch between candlestick and line, and choose 1D intraday (5-minute bars), 1W (hourly bars), 5D, 1M, 3M, 6M, YTD, 1Y, 5Y, MAX or a custom date range. Clicking an index card (S&P 500, Nasdaq, Dow, Russell 2000, Gold, US 30Y Yield) or any portfolio symbol name auto-loads it in the chart.
Yes. Every account is protected by TOTP-based two-factor authentication, optional Google sign-in, bcrypt password hashing and JWT-secured sessions delivered as httpOnly cookies with CSRF protection. Your data is sealed inside a per-user PostgreSQL isolation layer enforced at every API endpoint, and a full audit log records every login, password change and account action. Your financial data is never shared or sold.
Yes, completely free, with no subscription, no trial limits, no ads and no upsells. You get unlimited portfolios and unlimited transactions. Petru Ceciltan built Portfolio Analytics as an authoritative portfolio piece to democratize access to elite-grade analytics tools that are usually locked behind paid trackers.
No. Portfolio Analytics never links to a broker and requires no broker API connection. You add your transactions yourself or import them by CSV, and the app only ever fetches public market prices from the Yahoo Finance API. Because there is no brokerage credential anywhere in the system, there is nothing for an attacker to steal and nothing for a third party to harvest.
Yes, in one click. Deleting your account immediately schedules the permanent removal of every portfolio, transaction, cash entry and record tied to you, with a short grace period in case you change your mind. Once that window passes, your data is permanently purged from the database and cannot be recovered. You are always in full control of your own information.
Yes. Admins can create additional users, assign them under their account, and "View as" any of their users, which is useful for families or advisors. Super Admins can also export a full user's data as JSON and import it into another account in one click (merge-only, never destructive).
Portfolio Analytics was built by full-stack developer Petru Ceciltan. The project showcases expertise in Node.js, Express.js, PostgreSQL, JWT authentication, TOTP 2FA, Google OAuth and real-time financial data processing, all offered to individual investors at no cost.